¶ Thermometer
A widget to visually represent a parameter value as a thermometer with customizable thresholds and colors.
¶ Overview
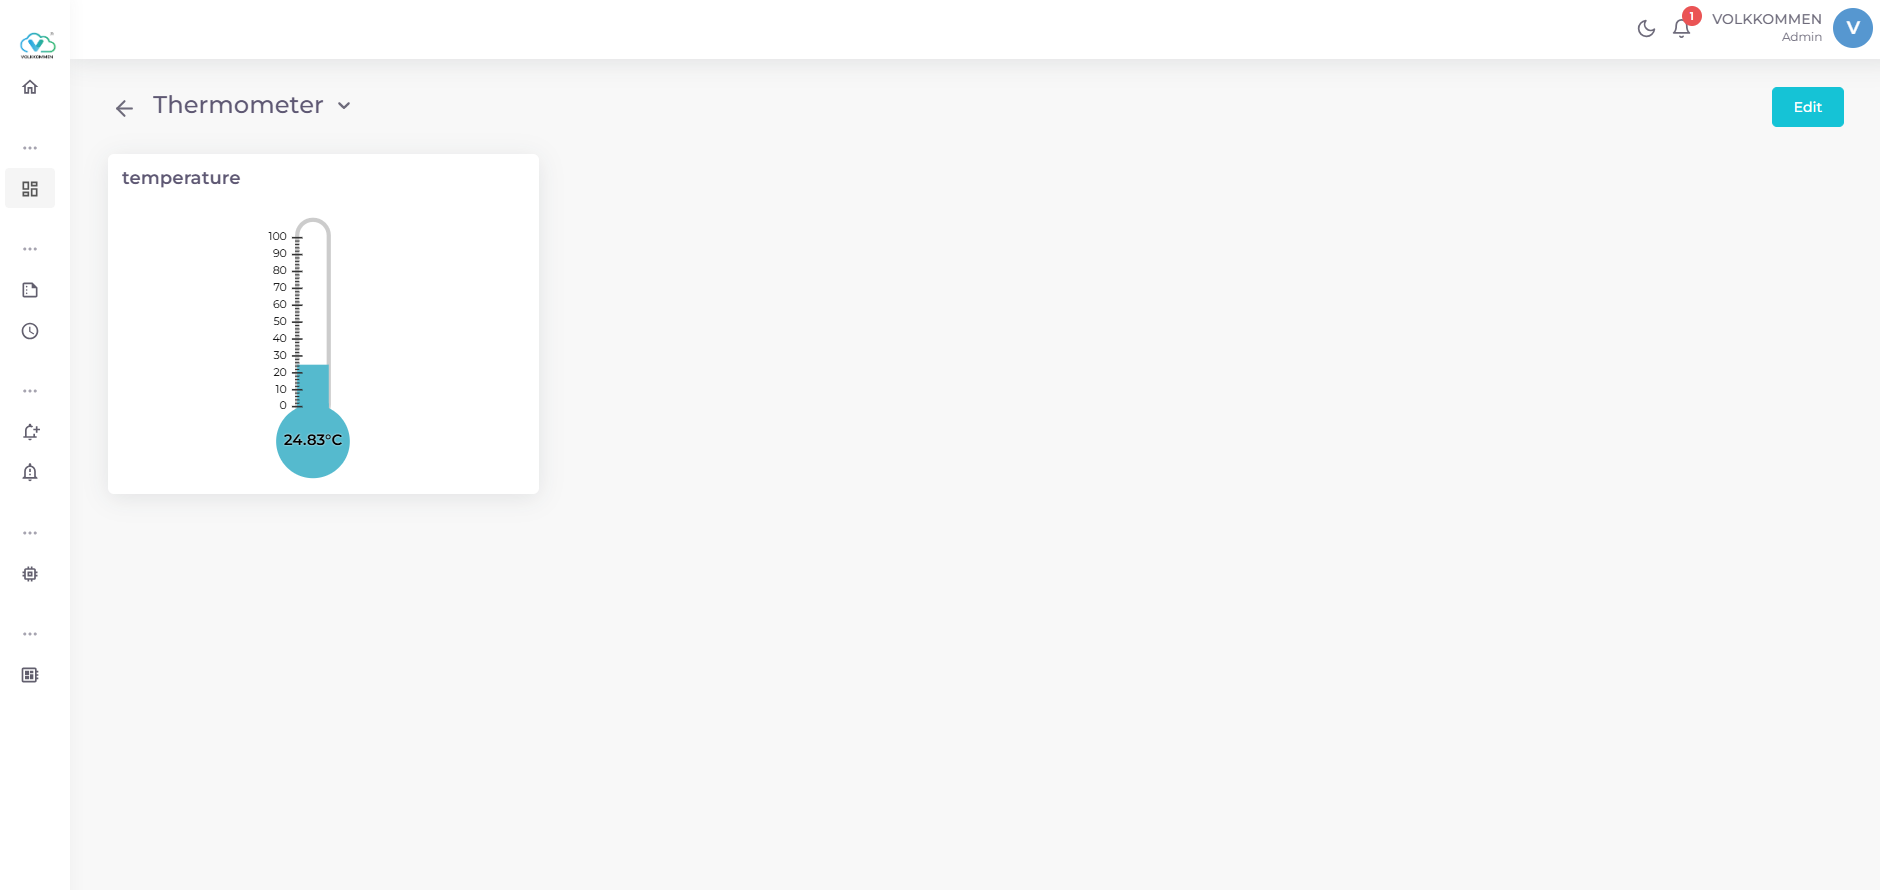
The Thermometer Widget displays a single parameter’s value as a thermometer, with a liquid-like fill that adjusts based on the value within a defined range. It is ideal for monitoring parameters like temperature, pressure, or other metrics with clear minimum and maximum bounds.
Key Features:
- Displays a parameter’s value as a thermometer with a dynamic fill level.
- Customizable minimum and maximum values for the scale.
- Configurable unit displayed with the value.
- Supports threshold-based coloring to highlight critical values.
- Overflow indicator for values exceeding the maximum limit.
- Responsive design adjusts to the widget’s container size.
¶ Data
Device and Parameter Selection:
- Use dropdowns at the bottom of the configuration panel to select devices and parameters.
- The widget displays the latest value of the selected parameter, fetched in real-time.
- Data is fetched in real-time.
Data Display:
- The value is shown in the thermometer bulb, formatted to two decimal places or as an integer if applicable.
- The unit is appended to the displayed value.
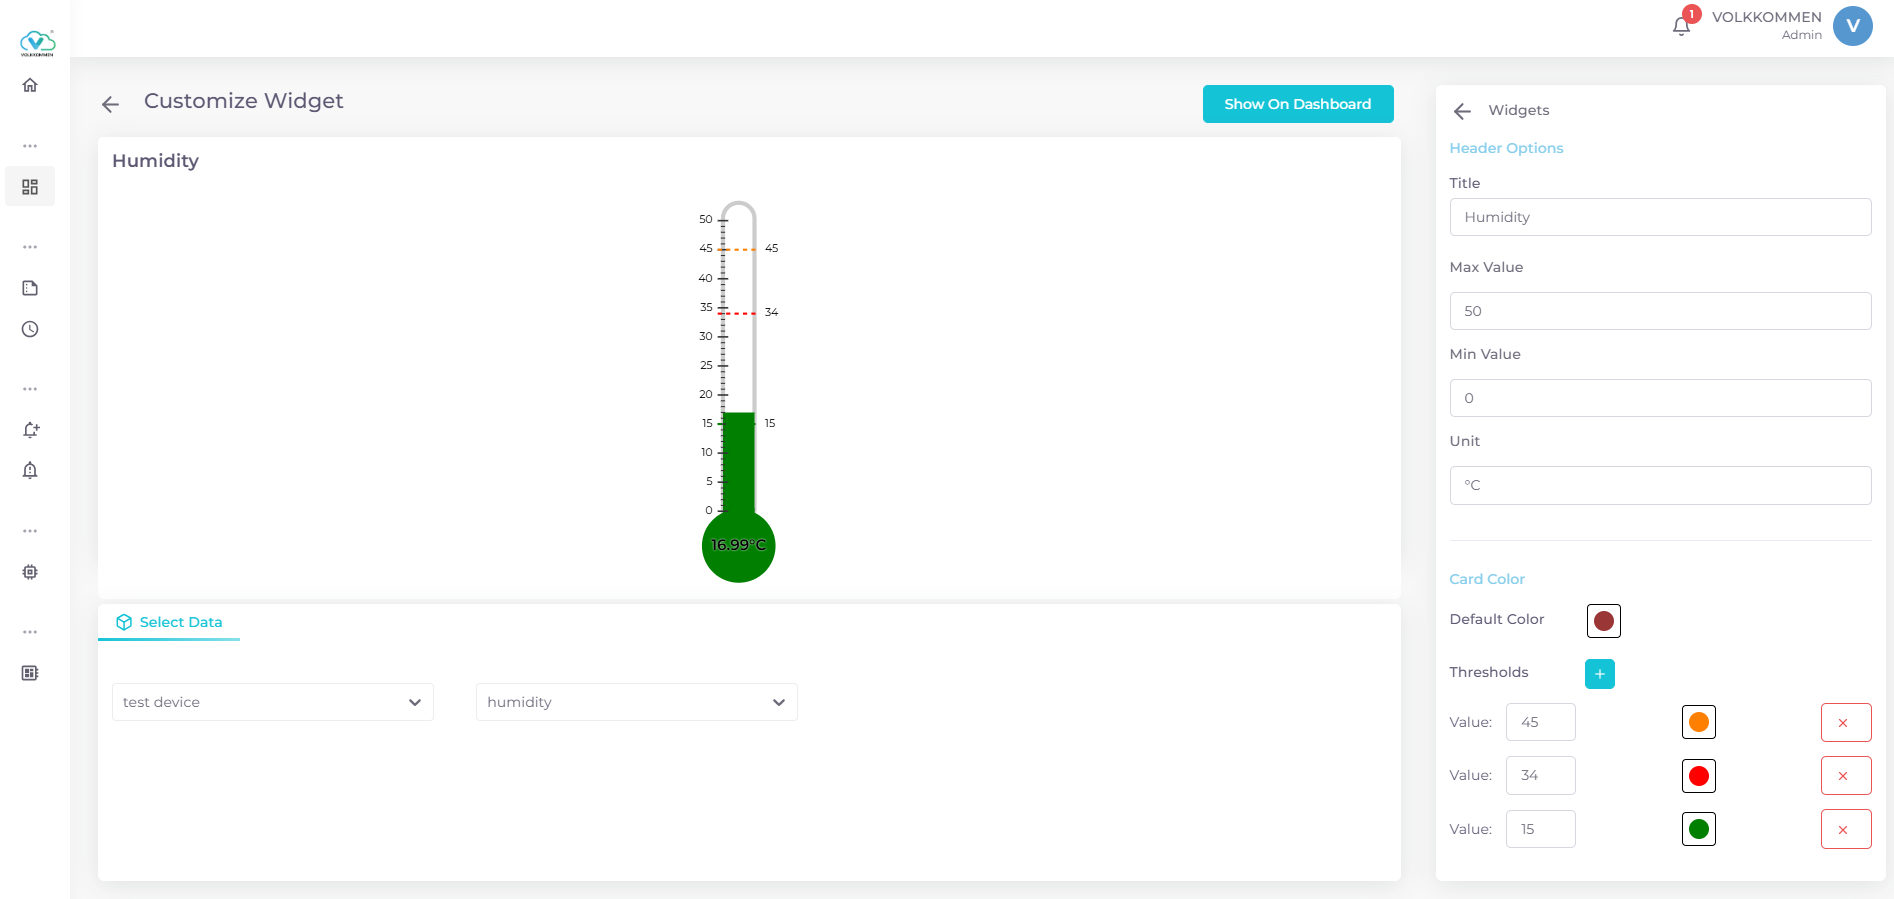
¶ Configuration
Title:
- Enter a title for the widget in the “Title” input field.
Value Range:
- Minimum Value: Set the lower bound of the thermometer.
- Maximum Value: Set the upper bound (default: 100).
Unit:
- Enter a unit ( e.g. °C, %) to display with the value.
Color Settings:
- Default Color:
- Choose a default fill color for the thermometer using a color picker.
- Thresholds:
- Add thresholds by clicking the “+” button.
- For each threshold, set a value and select a color.
- Delete thresholds using the “X” button.
- The thermometer’s fill color changes based on the highest threshold the value meets or exceeds.
Finalizing:
- Click “Show on Dashboard” to display the widget.
- In edit mode, use “Edit” or “Delete” buttons in the top-right corner to modify or remove the widget.